[Readmelater]

The sex ratio of the National Capital Territory of Delhi has been consistently skewed over three decades, shows a BehanBox analysis. The reason for this lies in the Capital’s location, right in the middle of a “cultural and geographical continuum” where gender preferential practices are rampant, say demographic experts. 

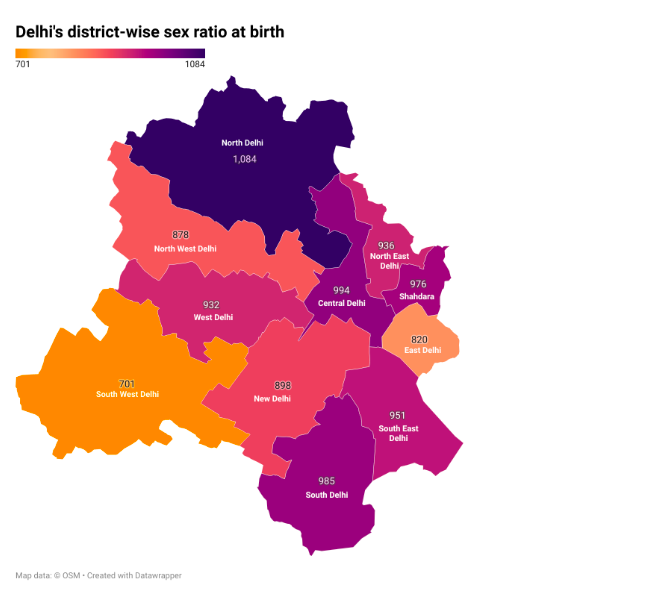
Delhi’s sex ratio is 913 women per 1,000 men, as per the latest and fifth round of National Family Health Survey (NFHS-5) conducted between 2019 and 2021. Its sex ratio at birth – a different figure because it is an estimate of all births during the last five complete calendar years – is 923 girls born per 1,000 boys.

The states and UTs with worse sex ratios currently are Chandigarh (917), Haryana (926), Punjab (938), and Jammu and Kashmir (948). 

Delhi’s numbers are lower than the national average for both, the sex ratio (1,020:1,000) as well as the sex ratio at birth (929:1,000). And this is despite an almost 10% improvement over the NFHS-3 number,  2005-2006, when the sex ratio was 814:1,000 and the sex ratio at birth 840:1,000. 

Globally, the natural sex ratio across populations is approximately 952:1,000, the World Health Organization estimates. Numbers that fall below this are considered indicative of gender bias, and the reverse is true too – progressive and gender-just regions tend to report more equitable sex ratios.

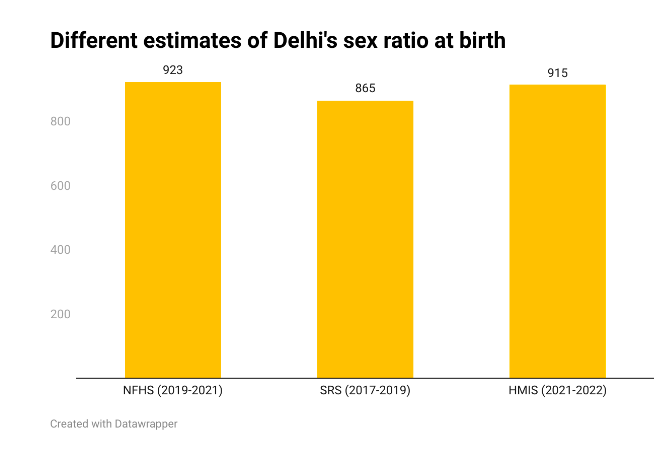
Delhi features among the bottom five states and union territories on sex ratio at birth according to every major data source we analysed – the Census, NFHS, the Sample Registration System (SRS), an annual, national and sub-national demographic survey on health indicators, and the Health Management Information System (HMIS), a government-run, web-based monitor.
India’s Census data is now over a decade-old and we have not used these in our calculations. But even according to the Census 2011, Delhi’s sex ratio was 868:1,000, again putting it among the worst five performing states.

Demographer Srinivas Goli argues that the HMIS would make for a better source for sex ratio if birth registrations are high – at least 95%. He points to the fact that the NFHS data mostly includes households that have women of reproductive age which may not be not entirely representative of the reality. However, Behanbox opted to use the NFHS data for its analysis because it provides the latest district-level data for sex ratio. 

Why is Delhi, home to the second highest number of wealthy households in the country as per the latest NFHS, not able to improve this indicator of gender equity? Here are some answers.

Cultural and geographical continuum

A critical reason is Delhi’s place on a cultural and geographical continuum where gender bias is rampant, says Goli, an assistant professor at the International Institute of Population Science. Delhi is sandwiched between Uttar Pradesh and Haryana, part of the wheat belt which is more prone to gender imbalance, according to a 2021 paper ‘Skewed Child Sex Ratios in India: A Revisit to Geographical Patterns and Socio-economic Correlates’ co-authored by Goli and Aradhana Kumari, a PhD student at the Jawaharlal Nehru University.

“At the centre of the socio-cultural norms in these two states is a son preference owing to patrilineality in inheritance of property and land,” he said.

Not only is Delhi’s sex ratio poor, some data sources also indicate that it is not showing any improvement with the passage of time. For instance, the latest SRS reports that in 2017-2019, it was just 865:1,000, a decline since 2015 when it stood at 869:1,000. 

The annual HMIS report puts Delhi’s sex ratio at birth for 2019-2020 at 915:1,000 – the third lowest among all states and union territories. This appears to have fallen further in 2022 – it was 907:1000 between April and June, 2022, shows the latest quarterly HMIS data

A big reason for son preference is patrilocality, Goli said. “Families economically devalue daughters owing to their higher prospect of migration following marriage. Therefore, any investment in the daughter’s future is not considered to be fruitful since they would eventually become a part of their husband’s family,” he said.  

Sons are also seen as “more dependable” for social security in old age, said economists like Simin Akhter Naqvi, faculty member of Zakir Hussain College in Delhi University. “The idea of co-residence with sons and the lack of old age-related social security provisions from the State also directly impacts the sex ratio. Whereas socio-cultural norms require a family to arrange for a daughter’s dowry and add to a family’s financial burden, constituting a proportionately large burden for the poor,” she said.

The economist said that the health and nutrition-related indicators as well as other demographic data in the NFHS allow her to correlate sex ratio values optimally. 

Gender discriminatory practises

Sex ratio is impacted by gender discriminatory natality practises, which can be both pre- and post-natal. “Pre-natal discrimination would include sex selective abortions or neglecting pregnancy after knowing the sex of the child, often leading to a still birth. Post-natal discrimination could be over differential feeding, immunisation and healthcare practises,” said Goli.

All kinds of data show that even if a female child is delivered, from infancy onwards her health is likely to be poorer than that of a male child. Here are some data that show why Delhi’s 2019-21 child sex ratio (912:1000) is much lower than its sex ratio at birth (923:1000):

  • In Delhi, mortality rates are higher for female children – the neonatal mortality rate is 19% for females and 15% for males, while the postneonatal mortality rate is almost 9% for females and 5.5% for males. The infant mortality rate for females is almost 28% against 21% in males, and the under-five mortality rate is 36% among girls and 25% in boys.  
  • Only 73% female children aged 12-23 months in Delhi had received all basic vaccinations as opposed to 79% male children, shows NFHS – 5 data. Further, 57% female children in this age group had received all the mandated vaccinations as opposed to 62% male children, per NFHS – 5. 
  • Only half of the female children aged below five years who had symptoms of acute respiratory infection received treatment from a professional healthcare provider as opposed to 60% of the male children with those symptoms, shows NFHS – 5. 
  • Help was sought from professional healthcare providers for only 80% female children aged under five with fever as opposed to 89% male children of the same age who had fever, show data.

Increasing son preference

To understand gender preference among families and communities, two indicators are important, says Goli. One is the “sex ratio at last birth” or the number of girl children born as the last child per 1,000 boys born last over five calendar years. The other is the “stopping rule” or the point at which families stop having children to ensure the desired number of sons.

“A sex ratio at last birth heavily skewed towards boys is indicative of son preference. Couples do not stop conceiving and giving birth until they have a son,” he said. The probability of a woman ending child bearing is much higher after she has birthed a boy, the demographer said. 

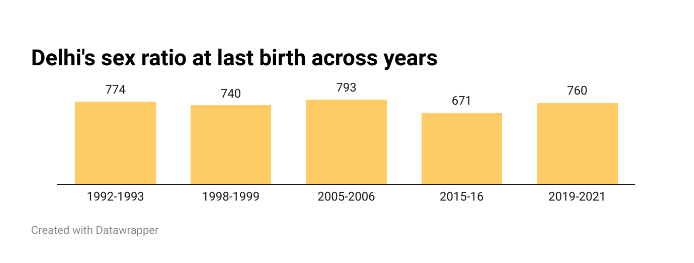
The trends of sex ratio at last birth in Delhi show a decline from 774:1,000 in 1992-1993 to 760:1000 in 2019-2021, indicating a high prevalence of son preference.

The desire for a son results in larger family sizes, said professor Naqvi. “Many parts of Delhi that house older establishments such as in central Delhi, the family sizes will be bigger than those in more recent establishments. A major reason for this is the socio-economic status of its population as well as the high concentration of minority communities,” she said.

Low female employment

The factors that lead to son preference are considerably distilled when women join the workforce, pointed out scholar Naqvi. “Every time a woman chooses to have a child, she loses out on at least 4-6 months of employment. Less children and more income in the family also takes away the pressure to necessarily have a male child to support them in their old age,” she said.

The labour force participation of women in Delhi is only 15% – the second worst after Bihar at approximately 11% – as opposed to 79% among the city’s men, according to the 2020-2021 report of the Periodic Labour Force Survey.  

A working woman’s ability to save increases regardless of where she is situated on the socio-economic spectrum, said Naqvi. “Women’s contribution to the household income also helps increase their autonomy which can result in reduced instances of female foeticide or infanticide,” she said.

  • Eisha Hussain is a multimedia reporter at Behanbox. Her work has covered issues around gender and sexuality, displaced communities from conflict zones, and protest cultures.

Girl in a jacket
Support BehanBox

We believe everyone deserves equal access to accurate news. Support from our readers enables us to keep our journalism open and free for everyone, all over the world.

Donate Now