[Readmelater]

Decoding women’s labour force participation in 2021-22: What the Periodic Labour Force Survey shows

After recording some improvement in recent years, the growth in female labour force participation rate in India now seems to be stagnating. Among the women who work, the share of those who are self-employed has been increasing in recent years, e

Key Highlights

  • Female labour force participation rate, on the rise since 2018-19, saw a marginal decline in 2021-22
  • Women’s workforce distribution has changed significantly in recent years, with self-employment increasing by 10 percentage points between 2017-18 and 2021-22
  • Women aged 15-19 are the most likely to be working as unpaid helpers, and men aged 30-59 are the least likely to be doing so
  • As compared to other employment types, self-employment has the highest gender earnings gap, with self-employed men earning 2.6 times more than self-employed women in April-June 2022
  • The share of women working in agriculture continued to be higher in 2021-22 than the pre-pandemic levels, while it decreased for men


After recording some improvement in recent years, India’s notoriously low female labour force participation rate (LFPR) seems to have stagnated, data from the Periodic Labour Force Survey (PLFS Jul 2021-Jun 2022) shows. 29.4 percent of women (aged 15-59) were part of India’s labour force in 2021-22, as compared to 29.8 percent in the preceding year. In contrast, men’s LFPR improved from 80.1 percent in 2020-21 to 80.7 percent in 2021-22.

These numbers reflect the labour force participation rate (LFPR) based on current weekly status (CWS). An individual is considered to be a part of the labour force by current weekly status if they were either employed (or looking for work (unemployed)) for at least one hour on at least one day in the week preceding the survey.

The conspicuously low share of women in the labour force is not a new trend. India has historically reported low FLFPR, which started declining soon after the turn of the millennium.

The cyclical nature of women’s work

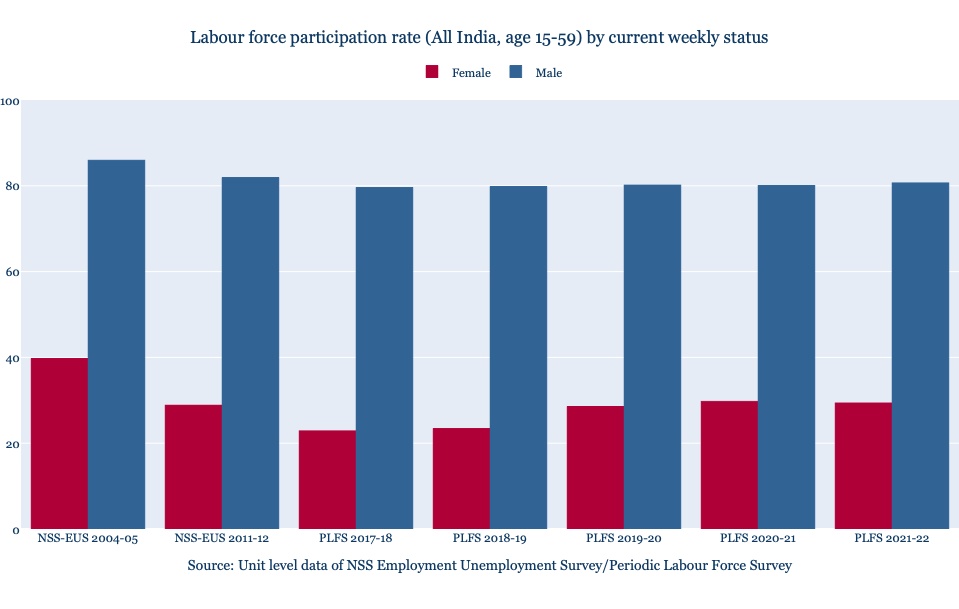
However, in recent years, women’s LFPR saw some improvement. In 2017-18, 22.9 percent of women aged 15-59 were part of the labour force. This improved to 23.4 percent in 2018-19, and saw a jump of nearly 5 percentage points in 2019-20. This period corresponds to July 2019 to June 2020, and includes the initial months of the Covid-19 pandemic when India was under a stringent lockdown brought in to check the spread of the new virus.

Research evidence indicates that even where women’s participation in the labour force is low, it often increases during times of crisis, indicating its counter-cyclical nature. In the 1999-2000 to 2004-05 period in India, for example, women’s participation in the labour force increased to supplement falling incomes in response to distress conditions in agriculture (Abraham, 2009). In their research, Mehrotra et al (2014) found that a large part (18 of 60 million, i.e. roughly 30%) of this increase in employment was due to rural women joining the workforce as self-employed workers in agriculture. In contrast, women quit agriculture in the high growth period of 2003-04 to 2011-12, but without an accompanying increase in non-farm employment, women’s overall LFPR fell in this period. 

More recently, in their research investigating the links between pandemic income shocks and FLFPR, Ishaan Bansal and Kanika Mahajan (2021)had found that the probability of women’s employment increased in households that experienced sharp negative income shocks induced by the pandemic-related lockdowns in India. However, this improvement in women’s employment was only transitory in nature, and women’s employment started to decline once the economic situation of households improved, they found, underscoring that women’s labour often acts as an insurance during low-income periods for poorer households.

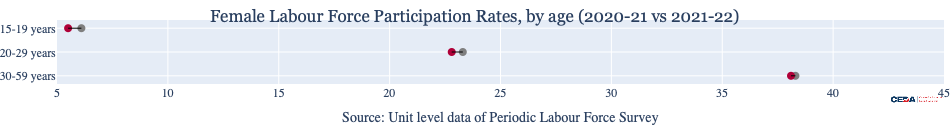
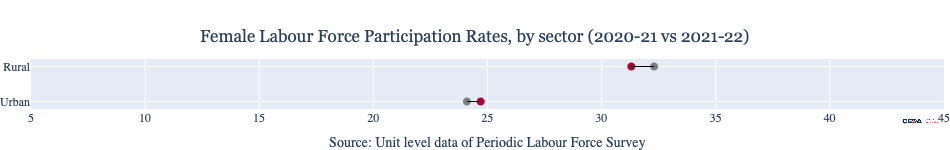
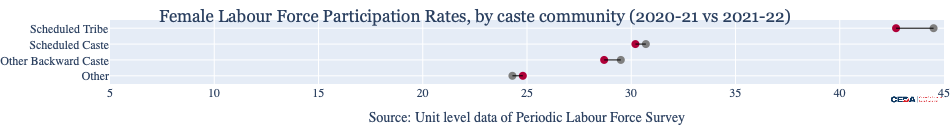
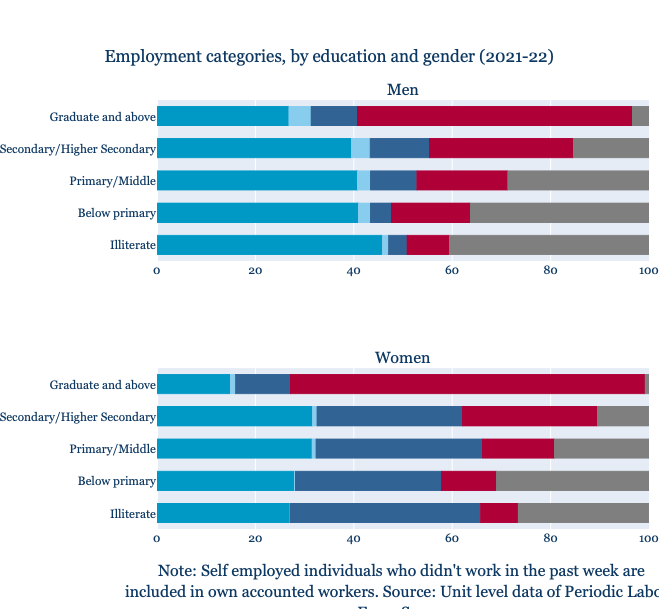
After increasing for another year, in 2021-22, the improving trend seems to have been arrested (Figure 1). However, the changes haven’t been homogenous for all women – in 2021-22, the LFPR saw small dips for rural women, women from Scheduled Tribe, Scheduled Caste, and Other Backward Class communities, as well as women who were illiterate or had primary-to-middle level of education. On the other hand, the LFPR among urban women, women with graduate (or higher) level education, or who were illiterate saw a marginal improvement between 2020-21 and 2021-22. (Figure 2)

Ongoing shifts in women’s work in India

Sixty percent of women (aged 15-59) who were working in India in 2021-22 were self-employed, the PLFS data shows. Among men, the corresponding share was 50.9 percent (Figure 3).

Self-employment includes a diverse set of individuals – from those who own a business with hired labour, to those who operate enterprises without any hired workers. It encompasses all individuals who do not work under a fixed contract and salary. Individuals may be self-employed because of a range of factors – this could be an aspirational choice but could also be a way to find work when one is not able to find wage or salaried employment.

“Self-employed” includes those who are own-account workers, employers or unpaid helpers. Among women who were self-employed in 2021-22, more than half (53 percent) worked as “unpaid helpers” and 44.5 percent were working as “own account workers” (those who operate their own enterprises without hiring any labour). Only 1 percent among those self-employed employed others in their enterprise. In comparison, of the men (aged 15-59) who were self-employed in 2021-22, 74.3 percent were own account workers, 5.9 percent were employers, and only 17.9 percent worked as unpaid helpers (Figure 4).

Working as an unpaid helper in a family-owned enterprise is a particularly inferior form of work – as it does not lead to independent income or increase women’s participation in the public sphere (Mehrotra, 2014). As Deshpande (2021) notes, much of the work undertaken by such workers includes “bottom-of-the-rung, survivalist livelihood activities”.

In 2017-18, 48 percent of women (aged 15-59) were self-employed, a proportion similar to that of men (48.9 percent), but this proportion has grown over the last four years. A similar growth has not occurred among male workers. And among women, this increase in self-employment has been driven largely by rural areas (Figure 5).

Similarly, among men and women of different age groups, women aged 15-19 were most likely to be self-employed and also most likely to work as unpaid helpers. In fact, in 2021-22, half (50.8 percent) of all women in this age group worked as unpaid helpers in 2021-22, up from 37.9 percent in 2017-18. Men above 30 years were the least likely to be working as unpaid helpers (4.4 percent).

The share of women working as unpaid helpers has increased for women regardless of their education levels, as Figure 6 shows, including those with higher levels of education. In 2017-18, 6.2 percent of women (age 15-59) with graduate (or higher) level of education worked as unpaid helpers. By 2021-22, this share had increased to 11.2 percent. At the same time, the share of those with this level of education having salaried jobs decreased from 79.7 to 72.1 percent.

A disproportionate presence in agriculture

According to PLFS, workers can be working on different types of enterprises including proprietary enterprises (enterprises in the informal sector where an individual is the owner), public sector enterprises, public private companies and others (such as employer’s households, cooperatives and trusts). In 2021-22, 68.5 percent of women worked on proprietary enterprises, up from 54.8 percent in 2017-18. In rural areas, the share of women working on proprietary enterprises is much higher: three out of every four (75.7 percent) rural women workers worked on proprietary enterprises in 2021-22, as compared to 59.3 percent in 2017-18. In urban areas, their share was 56.6 percent (up from 51 percent in 2017-18).

Since these shares also include agriculture enterprises (most of which are proprietary enterprises), we also examine the trends after excluding agricultural enterprises. The share of women working on proprietary enterprises in that case is 58.4 percent. This varies between 55 percent for urban women and 61.6 percent for rural women. 

This is not surprising since agriculture continues to employ an overwhelming share of women in India – 57.3 percent of the women aged 15-59 who were working were working in agriculture in 2021-22. In contrast, only 34.4 percent of the male workforce was employed in agriculture. 

As CEDA has documented previously, the number of people employed in agriculture increased significantly during the Covid-19 pandemic. As stringent measures brought in to check the spread of the new virus disrupted the economy and led to large-scale migration and job losses for millions of Indians, agriculture became a fall-back option for many. 

But the economic crisis had a gendered impact, the PLFS data shows. The share of women working in agriculture  increased in 2019-20 and 2020-21, the years of the pandemic, before registering a small decline in 2021-22. The share of men too increased, but not as much. More women were working in agriculture in 2021-22 than they were in the year preceding the pandemic. Among men, this was not the case (Figure 7). Additionally, of all working age women employed in agriculture, almost half (47.7 percent) were engaged as unpaid helpers (compared to 20.2 percent of men) and another 23.5 percent were working as casual labourers (compared to 19.3 percent among men) in 2021-22, the PLFS data shows.

Agriculture is a low-productivity, highly precarious enterprise, with volatile remuneration. The rise in agricultural employment beginning in 2019-20 has reversed the process of structural transformation in which workers move out of low productivity agricultural employment to high productivity sectors like manufacturing. Mehrotra et al. (2014) find that the productivity and wage difference between the two sectors is much higher in India than other Asian economies, such that a regression to agriculture leads to increasing inequality which in turn affects economic growth. 

Wide gender wage gaps, especially among those who are self-employed

On average, women workers earn much less than men across forms of employment. However, the gender earnings gap is most skewed amongst self-employed workers, the PLFS data shows. Among salaried workers, women earned INR 14,678 per month on average in the Apr-Jun 2022 period, while men earned INR 19,722 per month (1.3 times that of women). Those who worked as casual labour earned much less in general, but here too, men earned more on average. The average daily wage for women working as casual labour was INR 272, while for men earned INR 408 on average (1.5 times that of women).

Among those who were self-employed, the gap was wider. The average woman earned INR 5,311 per month in the Apr-Jun 2022 quarter, while the average man earned 2.6 times (INR 13,843). Additionally, women’s average monthly earnings decreased in each quarter of 2021-22, even as men’s average earnings went up. Consequently, the gender gap in earnings has only been widening over time (Figure 8). It is worth noting that earnings for those self-employed only include those who are employers and own-account workers, and exclude unpaid helpers. If the latter were to be included in the calculations, the average earnings would be much lower, and the gender-gap much wider.


[This article was originally published on the CEDA website.]

Girl in a jacket
Support BehanBox

We believe everyone deserves equal access to accurate news. Support from our readers enables us to keep our journalism open and free for everyone, all over the world.

Donate Now