Women Continue To Be Underrepresented in Delhi Assembly
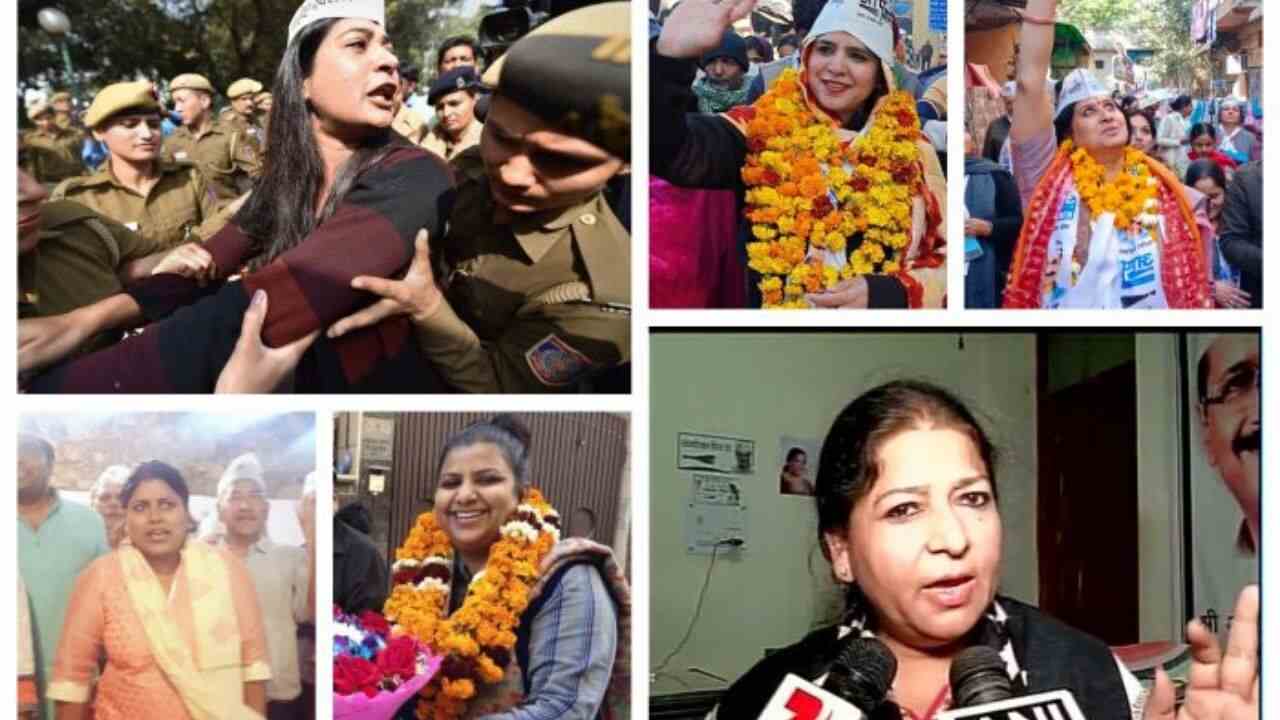
Delhi Vidhan Sabha, the elected body of the National Capital Territory of Delhi, has a dismal representation of women. Only 9% of the elected MLAs in the outgoing Vidhan Sabha were women. However, women contestants have increased by 17% in the upcoming elections from the last elections in 2015. While the Aam Aadmi Party (AAP) and the Indian National Congress (INC) have increased the share of tickets given to women, the Bharatiya Janata Party (BJP) has given fewer tickets to women since the last elections.
As Delhi votes to elect its next Vidhan Sabha, BehanBox analyses data to construct a history of women’s political representation and participation.
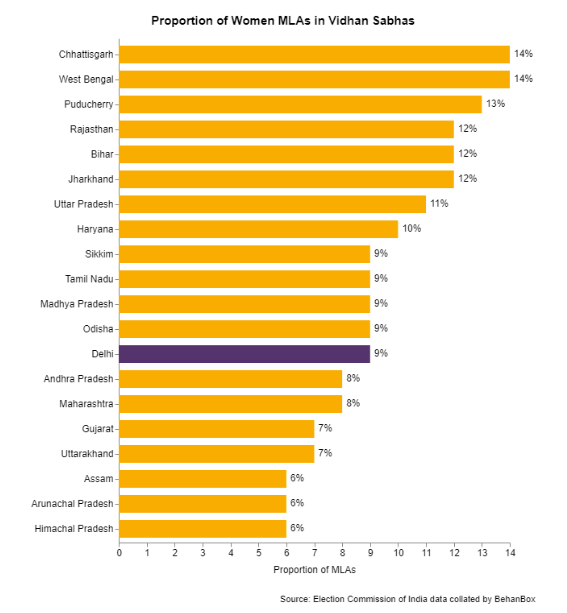
Delhi At The Bottom Of The Top 10 States With The Highest Representation Of Women
The dismal state of women’s representation in India’s Vidhan Sabhas is evident from the fact that only 8 of 29 state legislatures have more than 10% women MLAs, far short of a minimum 33% that women in India have been advocating for. Delhi with 9% women MLAs lies at the bottom of the table of the top 10 states with the highest representation of women.
[Image description: Horizontal bar chart ranking states based on the percentage of women MLAs in Vidhan Sabhas. Chattisgarh, West Bengal-14%, Puducherry-13%, Rajasthan, Bihar, Jharkhand-12%,UP-11%, Haryana-10%, Sikkim, Tamil Nadu, Madhya Pradesh, Odisha, Delhi-9%, Andhra Pradesh, Maharashtra-8%, Gujarat, Uttarakhand-7%, Assam, Arunachal Pradesh, Himachal Pradesh-6%]
Women MLAs Over The Years In Delhi State Assembly

The second Vidhan Sabha ( The first Vidhan Sabha elections were held in 1951 but no gender disaggregated data is available) in 1972 had 5% women MLAs which has only increased to 9% in the last Vidhan Sabha.
Delhi saw the highest ever women’s representation in the Vidhan Sabha in 1998, where 13% of MLAs were women. Thereafter, the number saw a steady decline with only 4% women MLAs in 2008 and 2013, with a marginal rise in the last elections.
Marginal Increase In Women contestants

Women form only 12% of the total contestants in the upcoming elections, a marginal increase from 10% in 2015, in Delhi according to data compiled by the non-profit Association of Democratic Reforms. Between 2015 and 2020, women contestants have increased marginally by 17%.

Historically, women contestants saw a steady rise from 1972 to 2008 when 81 women, highest in Delhi’s history contested the elections. The number of independent women candidates has been decreasing steadily since 2008.
AAP And INC Increase Tickets, BJP Gives Fewer Tickets To Women

Among the main parties, AAP and INC have increased the proportion of women candidates among their total contestants, while BJP has given fewer tickets to women in the upcoming elections.
AAP has increased their share of women contestants from 9% in 2015 to 13% in 2020. The INC, which historically gave the highest proportion of tickets (17%) to women in 2003, has once again allocated the largest share of tickets to women among all the main parties in the upcoming elections. The party has doubled its share from 7% to 15% between 2015 and 2020. BJP has reduced its share of women contestants from 12% to 7% over the same period.
Scheduled Caste women MLAs in Delhi’s Vidhan Sabha Remain Constant
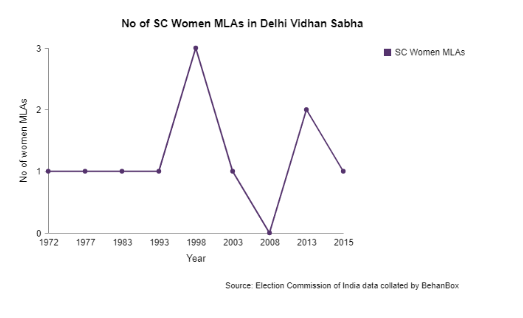

Although there is a rise in the number of women contesting from SC communities, not more than 3 women winners have been elected in any election. In 2008, when the number of women contestants was the highest with 81, no Scheduled Caste woman has won the election.
We believe everyone deserves equal access to accurate news. Support from our readers enables us to keep our journalism open and free for everyone, all over the world.
